Notes › ENGR 2341: Signals and Systems Lecture 7
Spectrum Signals
216 words 1 min Modified
Table of Contents
Spectrum
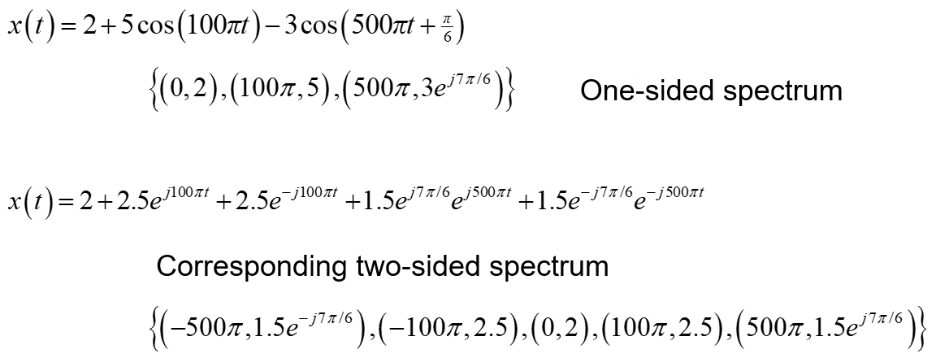
- The spectrum of a signal is the frequency content of the signal
- Represented as a list of frequency-amplitude pairs or a complex amplitude vs frequency plot
- Negative complex amplitudes are impossible! To normalize negative amplitudes, add/subtract $\pi$ to the phase $\phi$
Plots
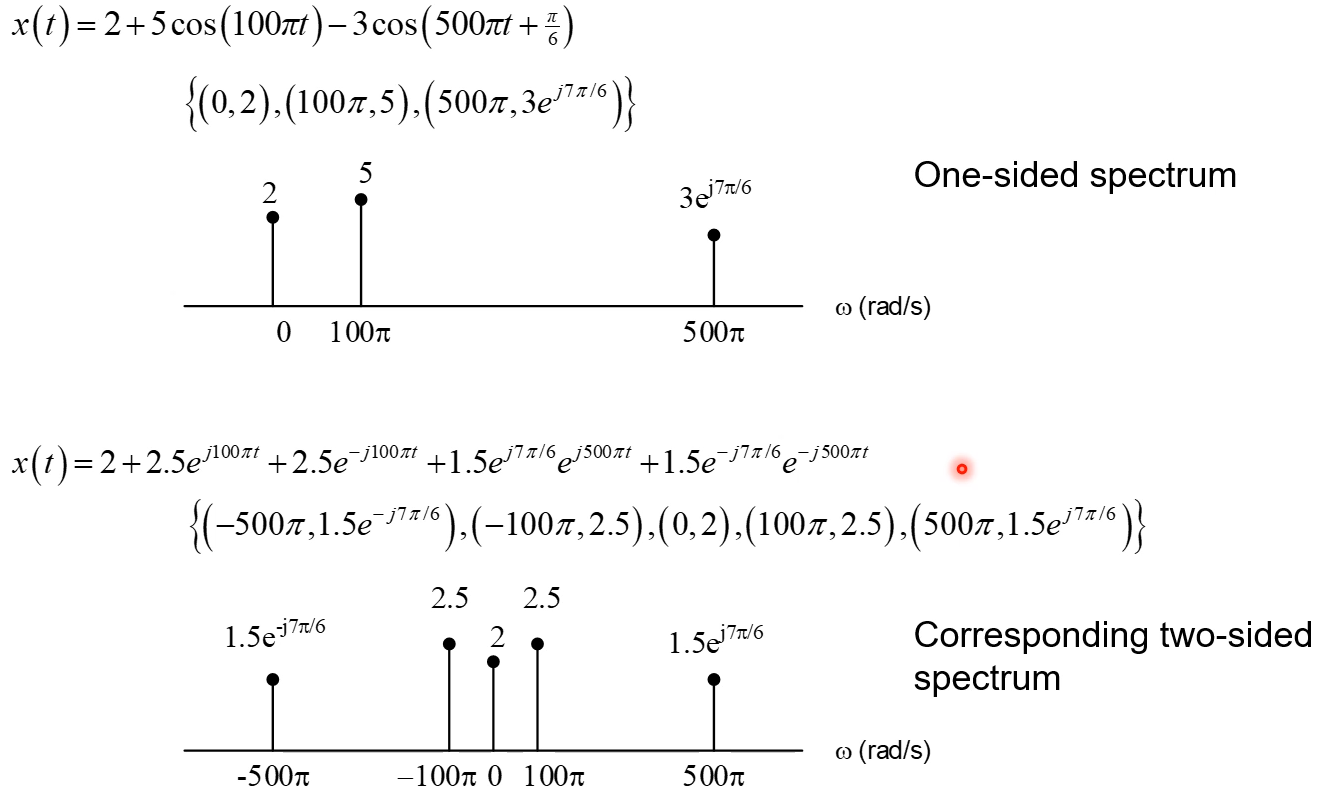
- One-sided spectrum plots use the sum of cosines
- Two-sided spectrum plots use the Sum of complex exponentials obtained using Inverse Euler
- Spectrograms have time on $x$-axis and $\omega$ on $y-axis$, with the magnitude of the spectrum being colored (like a heat map)
Sinusoidal Signals
- Signals can be expressed as a sum of sinusoidal signals
- Two forms: cosine and complex exponential
Cosine Form
- Amplitude is $A$
- $\omega$ is radian frequency (rad/s)
- $\phi$ is phase (rad)
Complex Exponential form
- Each cosine comes with two pieces
- Each piece has half the amplitude
- One piece has $\omega \gt 0$ and the same phase
- The other piece has $\omega \lt 0$ and negated phase
References
- Spectrum modulated signals (course handout)
- Spectrum sinusoidal signals (course handout)
- Sinusoidal signal (course handout)
Sources
- Sinusoidal signal
- Spectrum modulated signals
- Spectrum sinusoidal signals